In the last post we already looked at memory dumps and profiler traces, but going that deep can be time consuming. Luckily Application Insights provides somewhat similar tooling out of the box by giving you a built-in .NET Profiler and automatic “AI” analysis under the name Code optimizations
Ensure your logging is configured correctly, start capturing data and analyse the issues.
Note: When the Application Insights Profiler for .NET is actively running and collecting traces, it typically adds between 5% to 15% of CPU and memory overhead to your server. There is no additional cost for storing data captured by .NET Profiler. The data is automatically deleted after 15 days.
On the screenshots below you notice very high memory and CPU allocations to specific code paths:
- A .ToList() using 19% memory (of 32GB) means you’re loading way to much data from your database and should start looking at those specific queries.
- We can spot further issues with our Entity Framework setup/usage with excessive allocations for change tracking, queries, …
- AutoMapper seems to be using excessive memory as well, while Newtonsoft.Json seems to be chugging CPU.
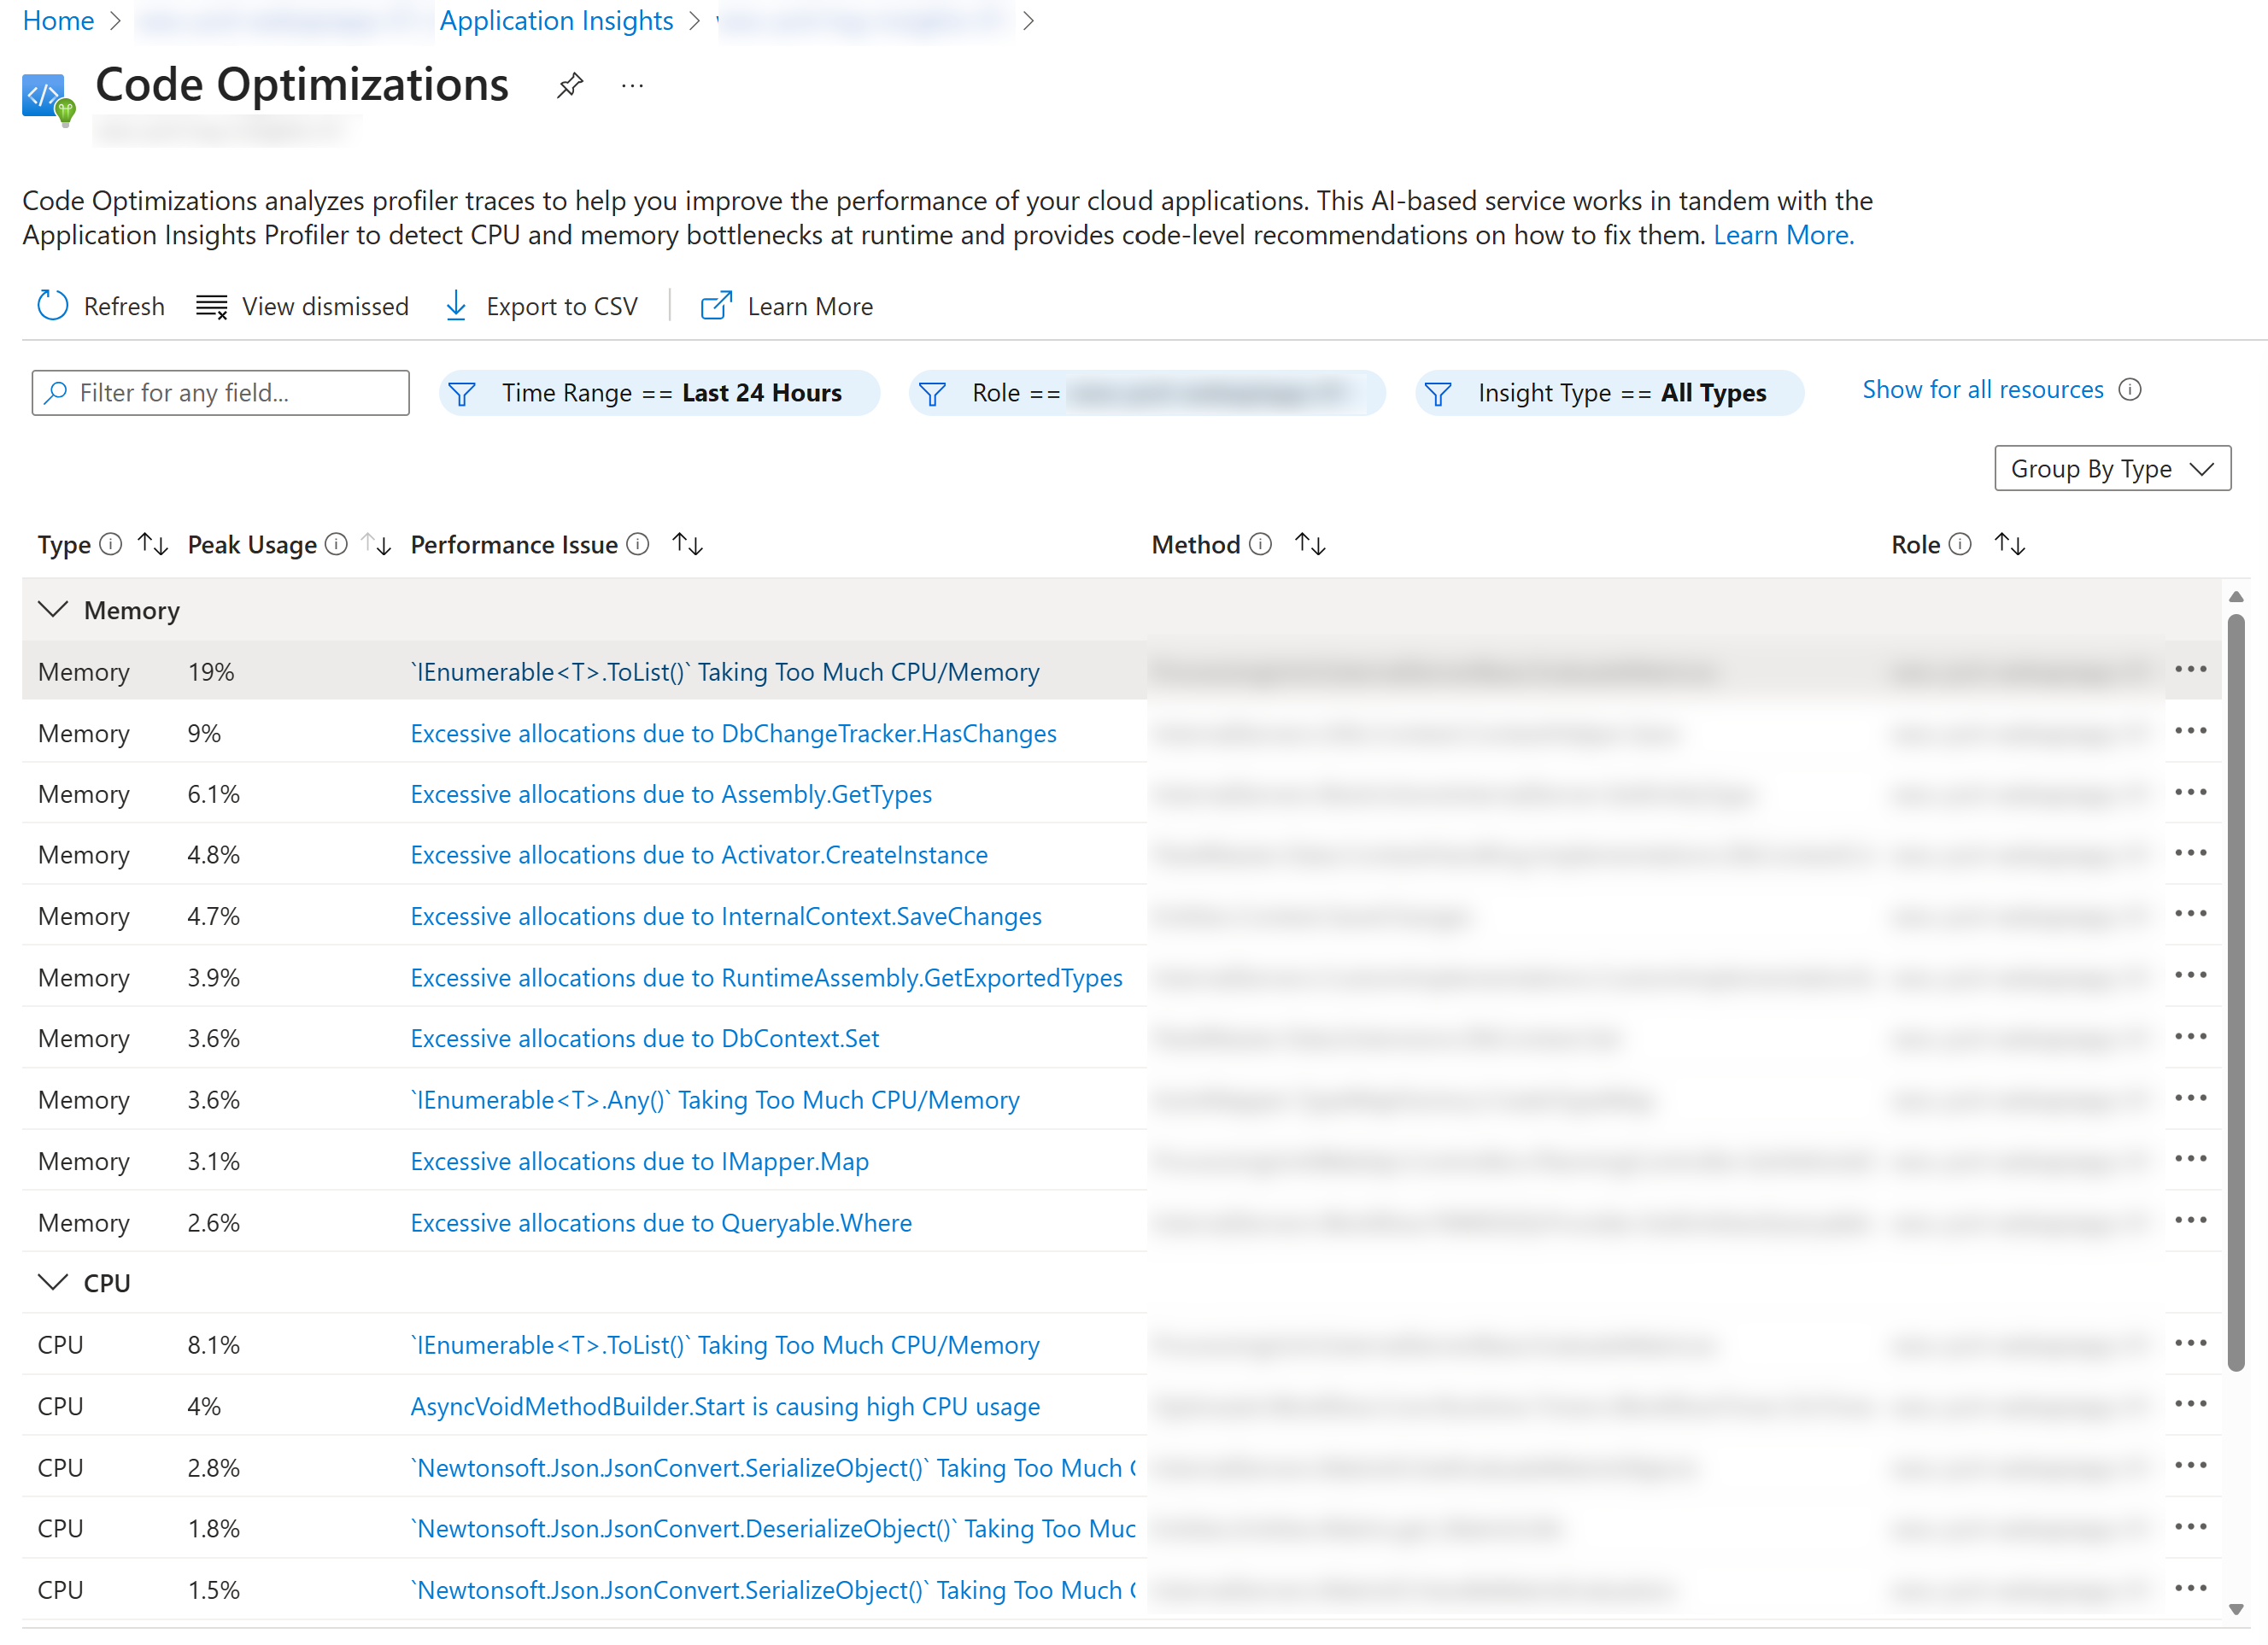
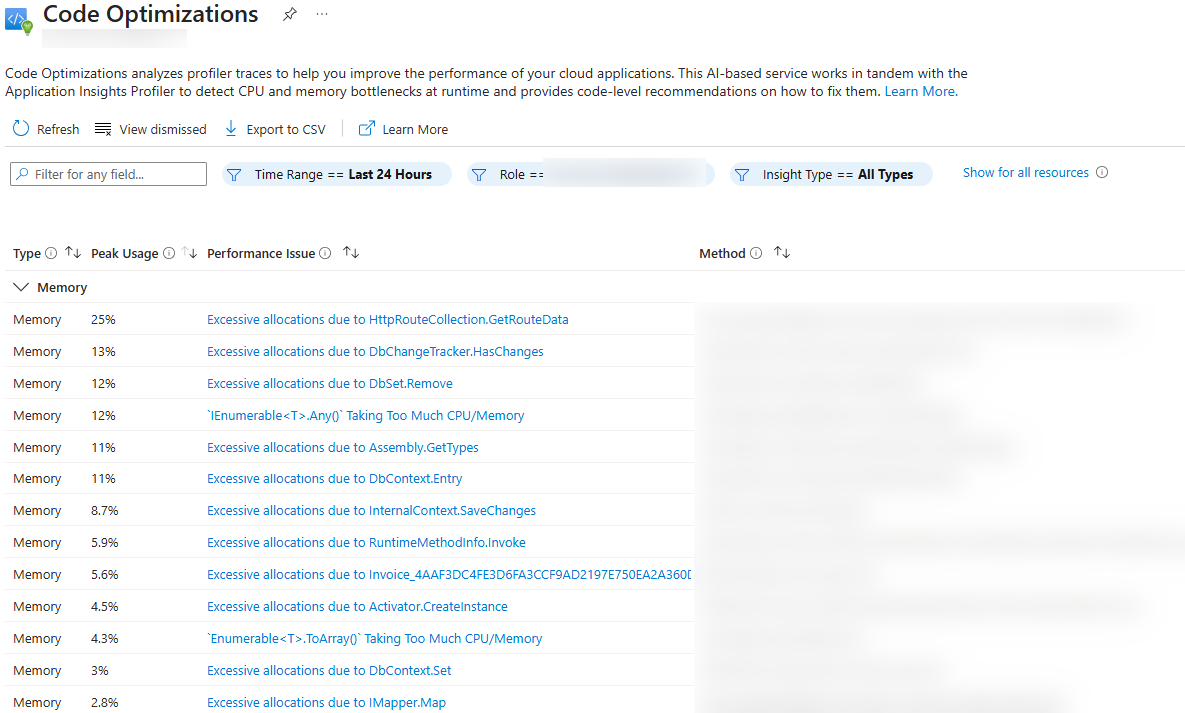
Even though the actual call sites are blurred, every request that shows up here is traced back to its initial call site so you have a headstart troubleshooting those.