When things are burning, you typically don’t have a lot of time. Or the performance issues might have been recurring on a certain interval, but you’re always failing to capture the right moment. It would be handy if you had a memory dump of the exact moment when the compute was choking.
This can be done by capturing that memory dump either at the moment itself or planning it to be captured through ‘proactive CPU monitoring’.
Simply go to your App Service that gives issues, scroll all the way down in the navigation bar to “Support + troubleshooting”. Next click the link to Diagnose and solve problems.
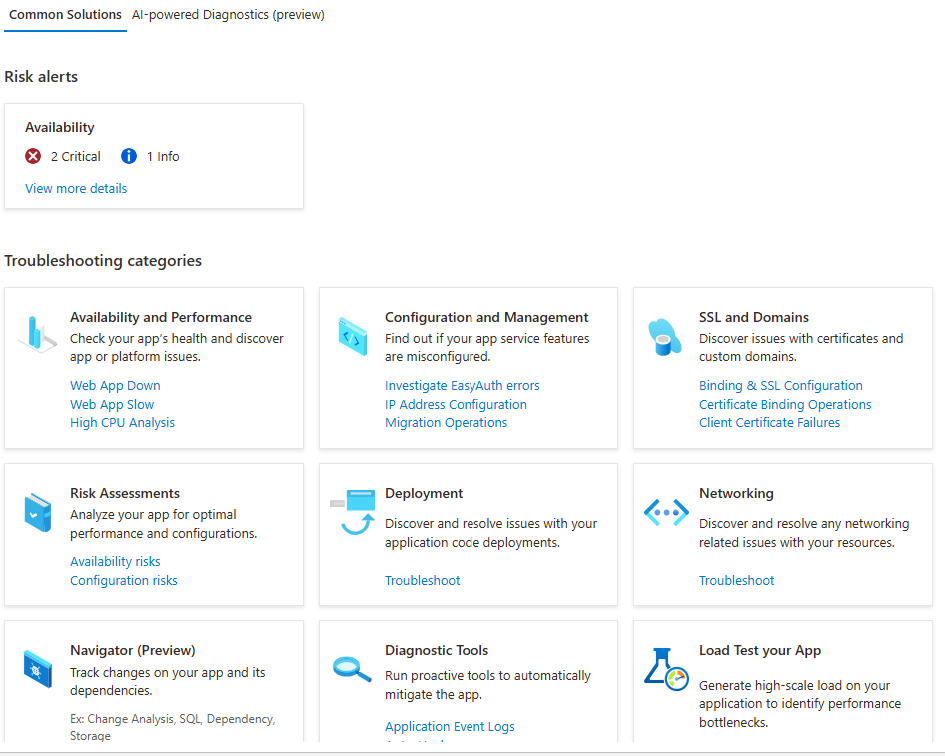
You can pick the right issue from the list, but ‘Web App Slow’ (could be e.g. high memory) or ‘High CPU Analysis’ are good entry points.
If lucky you can already ask for some solutions …
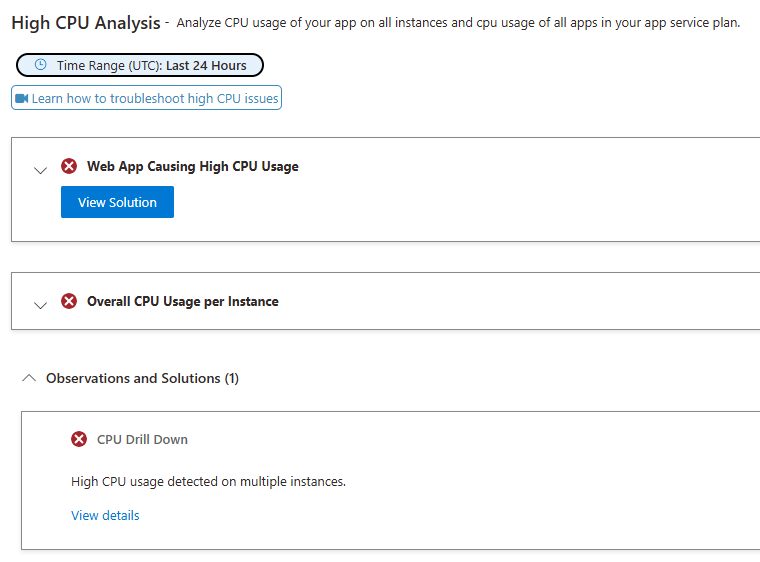
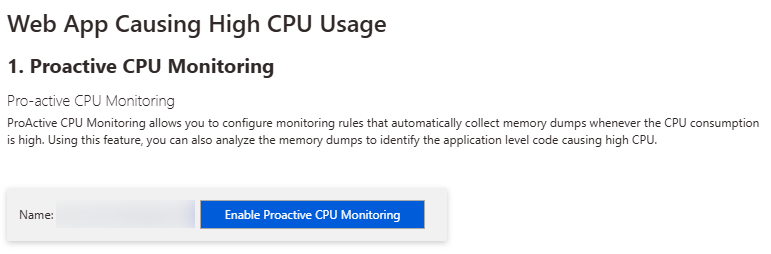
… but often you will need to configure monitoring so it captures the issue the next time.
Configuration of what and when to capture can be very finegrained. You can also limit to a certain period looking forward.
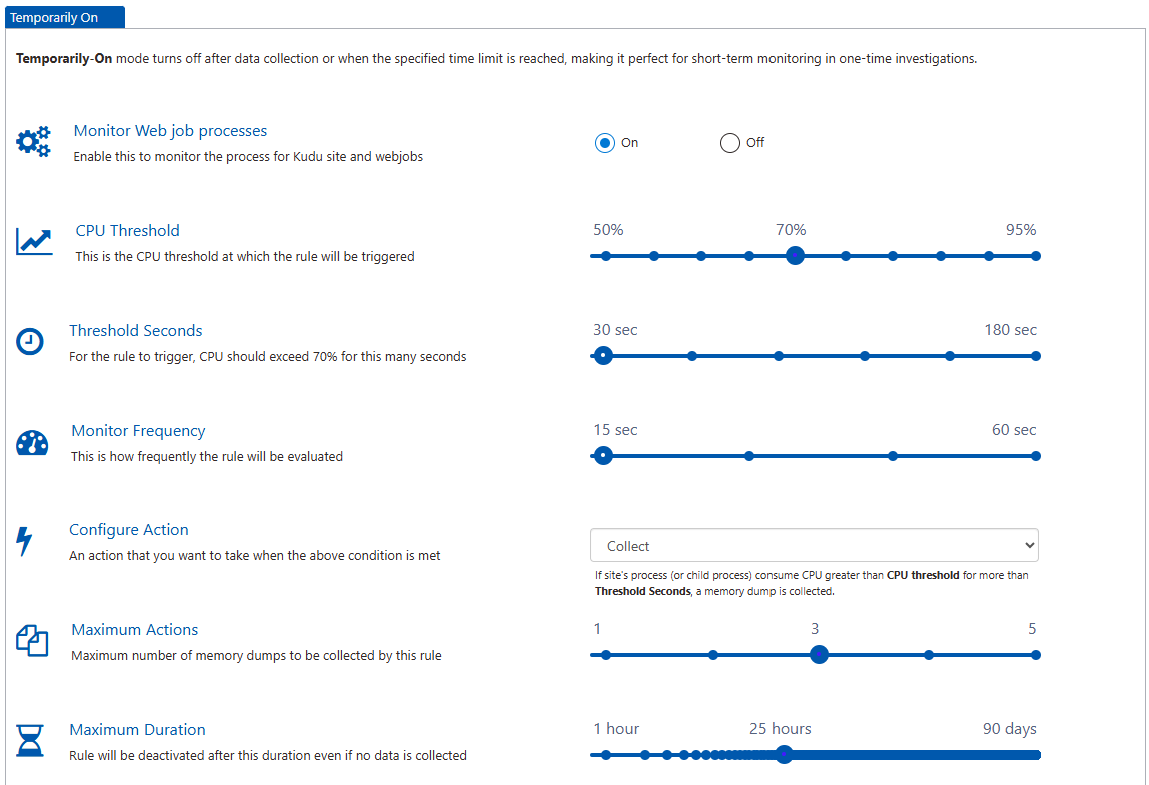
Finally, you’ll want to capture the memory dump or profiler trace depending on what you’re troubleshooting.
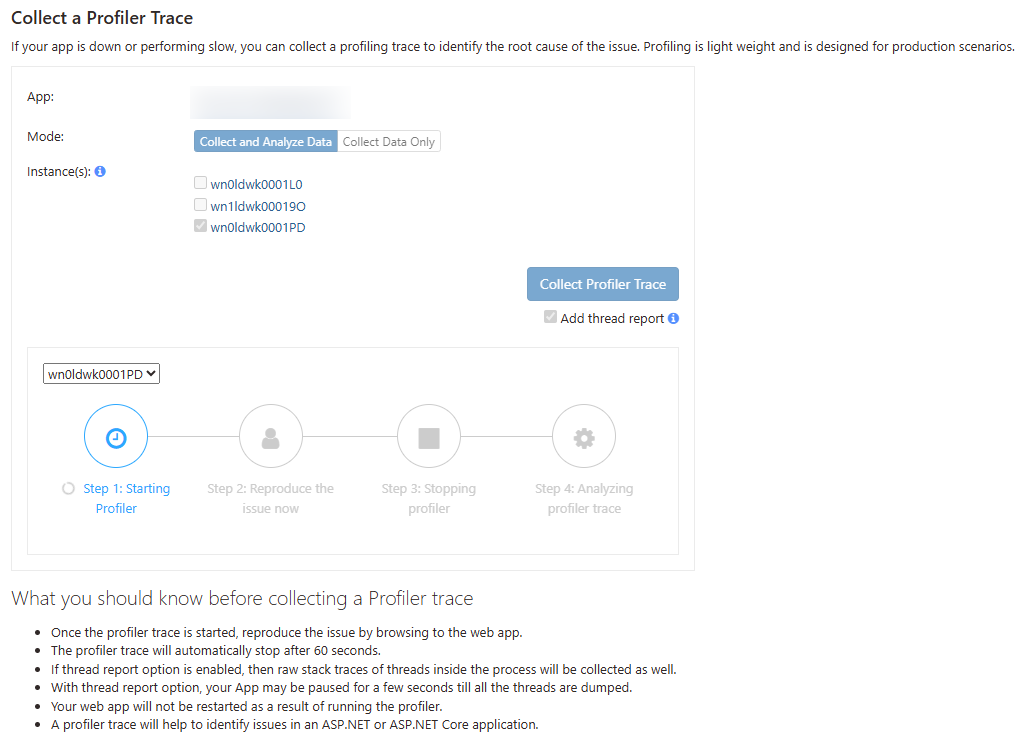
Analyzing profiler trace
The profiler trace can be analyzed in the portal itself and will give you hot paths and call durations.

Analyze memory dump
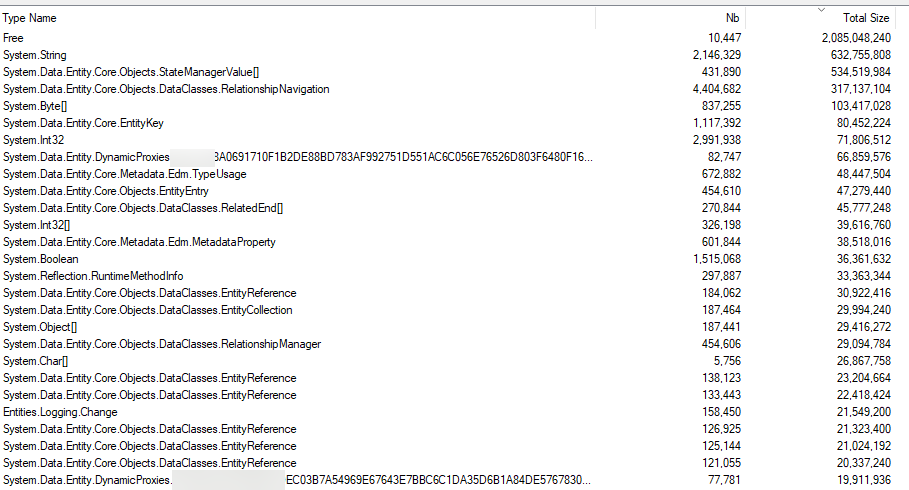
You can use tools like WinDbg to look into memory dumps, but I can also recommend Memoscope. This tool allows you to look at the actual objects and counts.
For this particular memory dump, we notice quite a bit of the memory was used by strings but also a lot by Entity Framework (80% of the top records were related to EF).
If we dig a little deeper, you even notice almost 350.000 times the same string value, another 156.000 times the value ‘Modified’ and twice 82.000 memory allocations for a string representation of time.
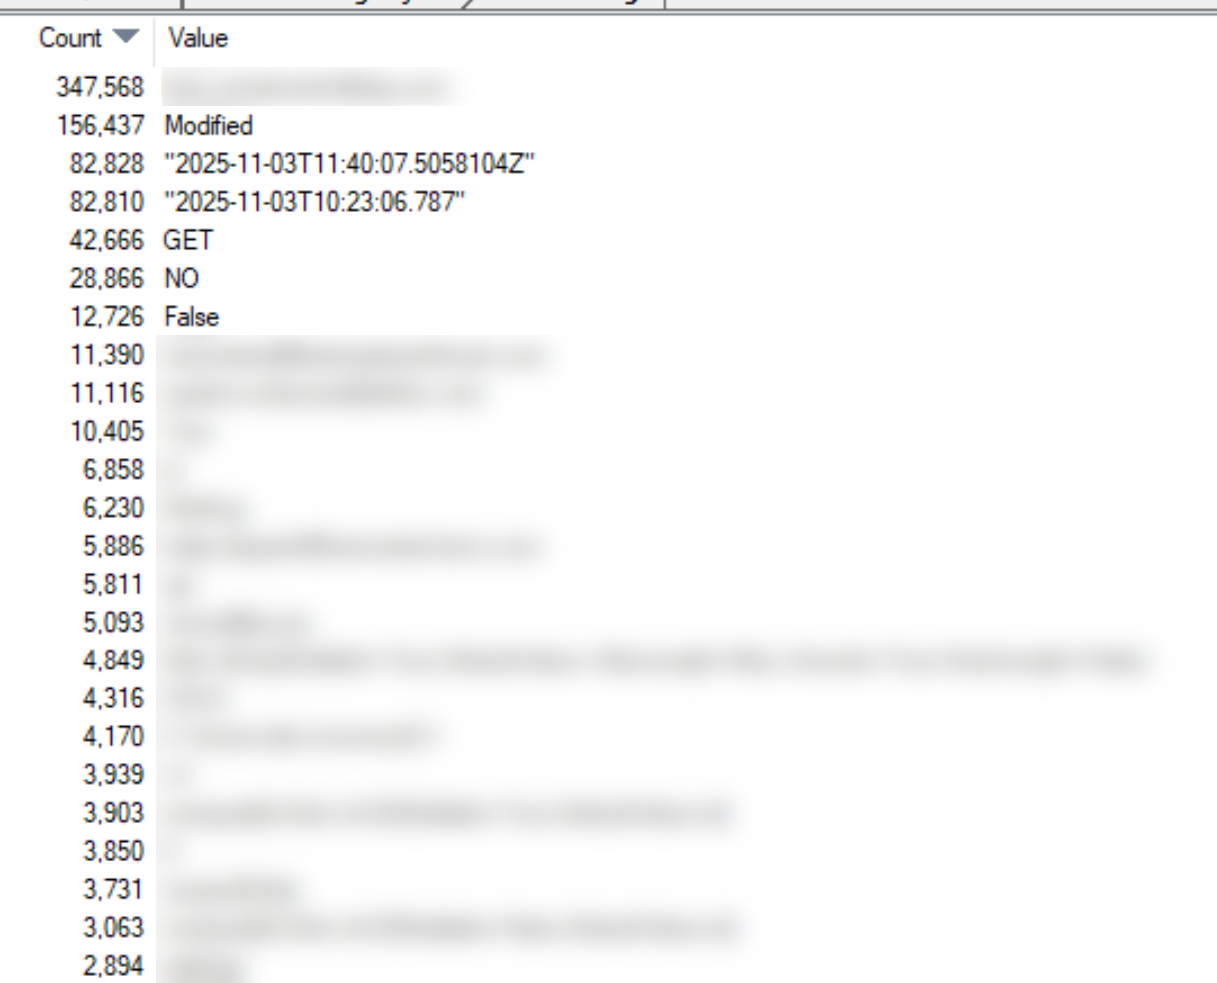
Starting with this info you can go dig in your codebase and reduce memory allocations.